Real-time Monitoring Interface Guide
This guide explains how to navigate and use NetFUNNEL's real-time monitoring interface, including screen layout, UI elements, and operational controls. For detailed explanations of what each metric means and how to interpret them, see the Metrics Quick Reference documentation.
Overview
The real-time monitoring interface provides two view modes:
- Default View: Numerical data in table format for quick comparison and precise decision-making
- Classic View: Visual funnel animation showing traffic flow patterns
Both views display the same underlying data. Switch between views using the view mode selector.
View Mode Selection
Switch between Default View and Classic View using the selector at the top-right of the screen.
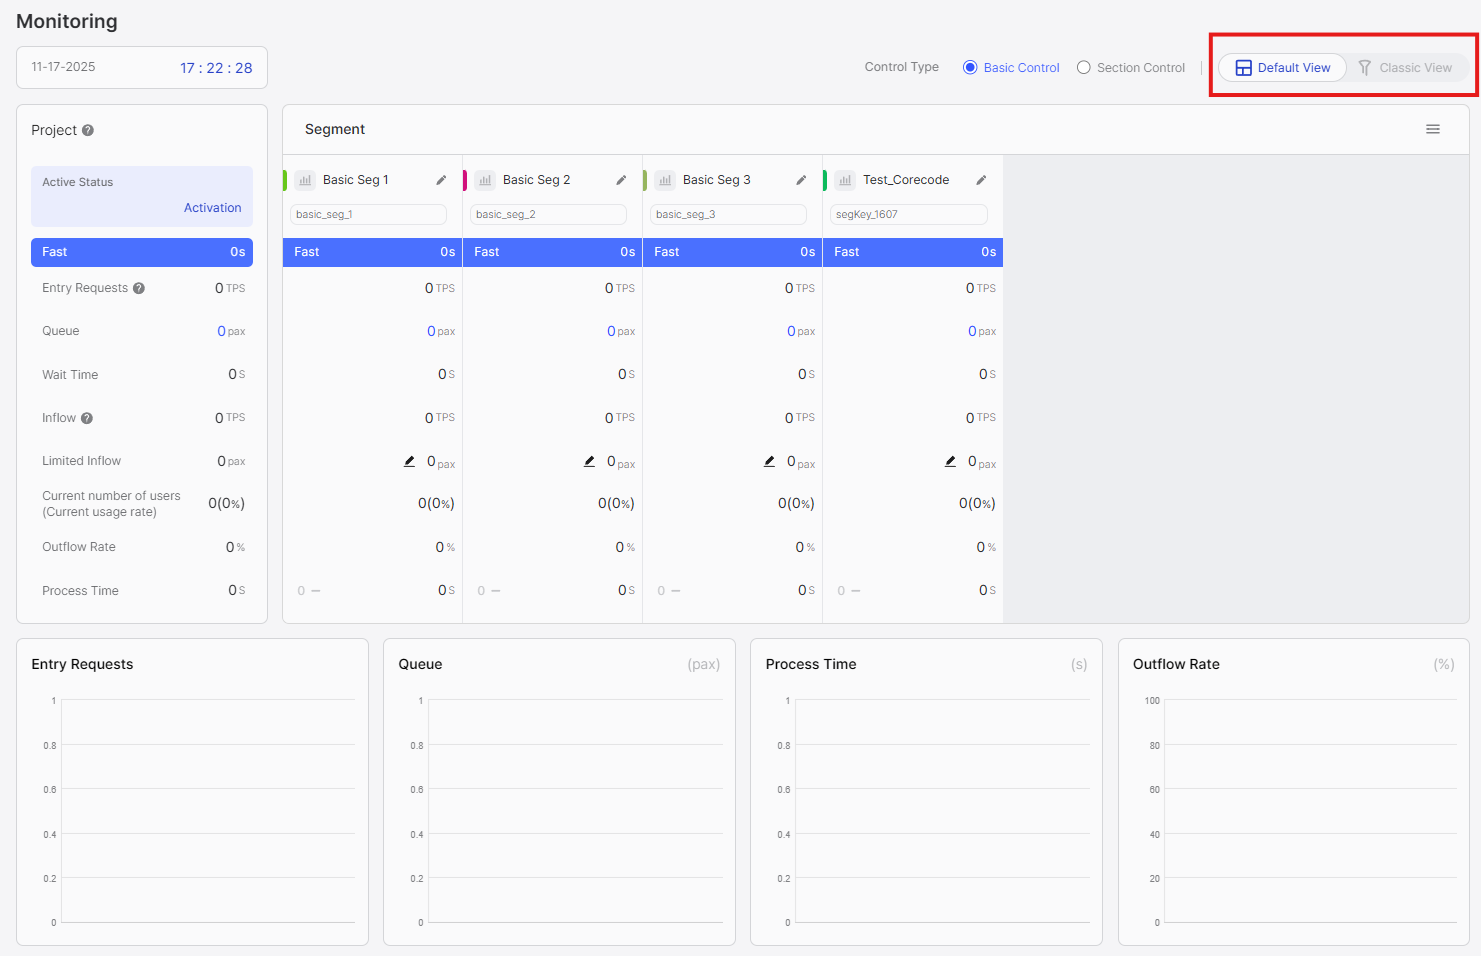
Click "Default View" or "Classic View" to switch between modes. All metrics remain the same—only the presentation format changes.
- Default View: Quick numerical comparisons and precise capacity adjustments
- Classic View: Continuous monitoring and visual pattern recognition
Screen Refresh and Data Updates
Real-time Updates
Metrics update automatically every second. No manual refresh is required.
Default View
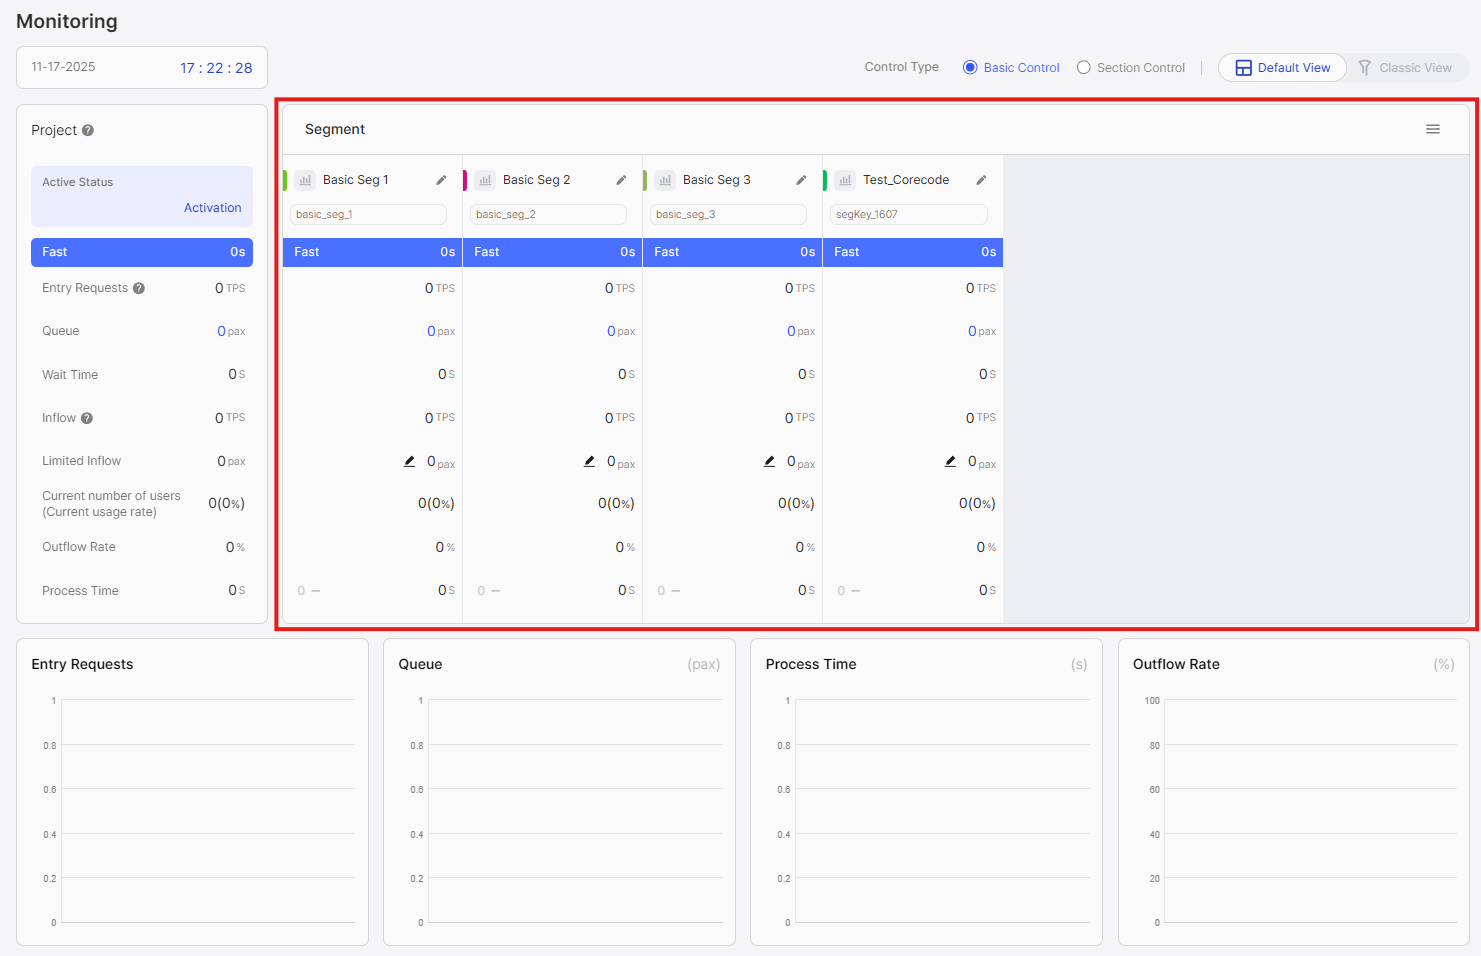
Default View presents metrics in a structured table format, making it ideal for numerical comparison and rapid decision-making during operational events.
Screen Layout
Default View consists of several key sections:
- Control Type Selection: Select which type of segments to view (Basic Control or Section Control)
- View Mode Selector: Switch between Default and Classic views
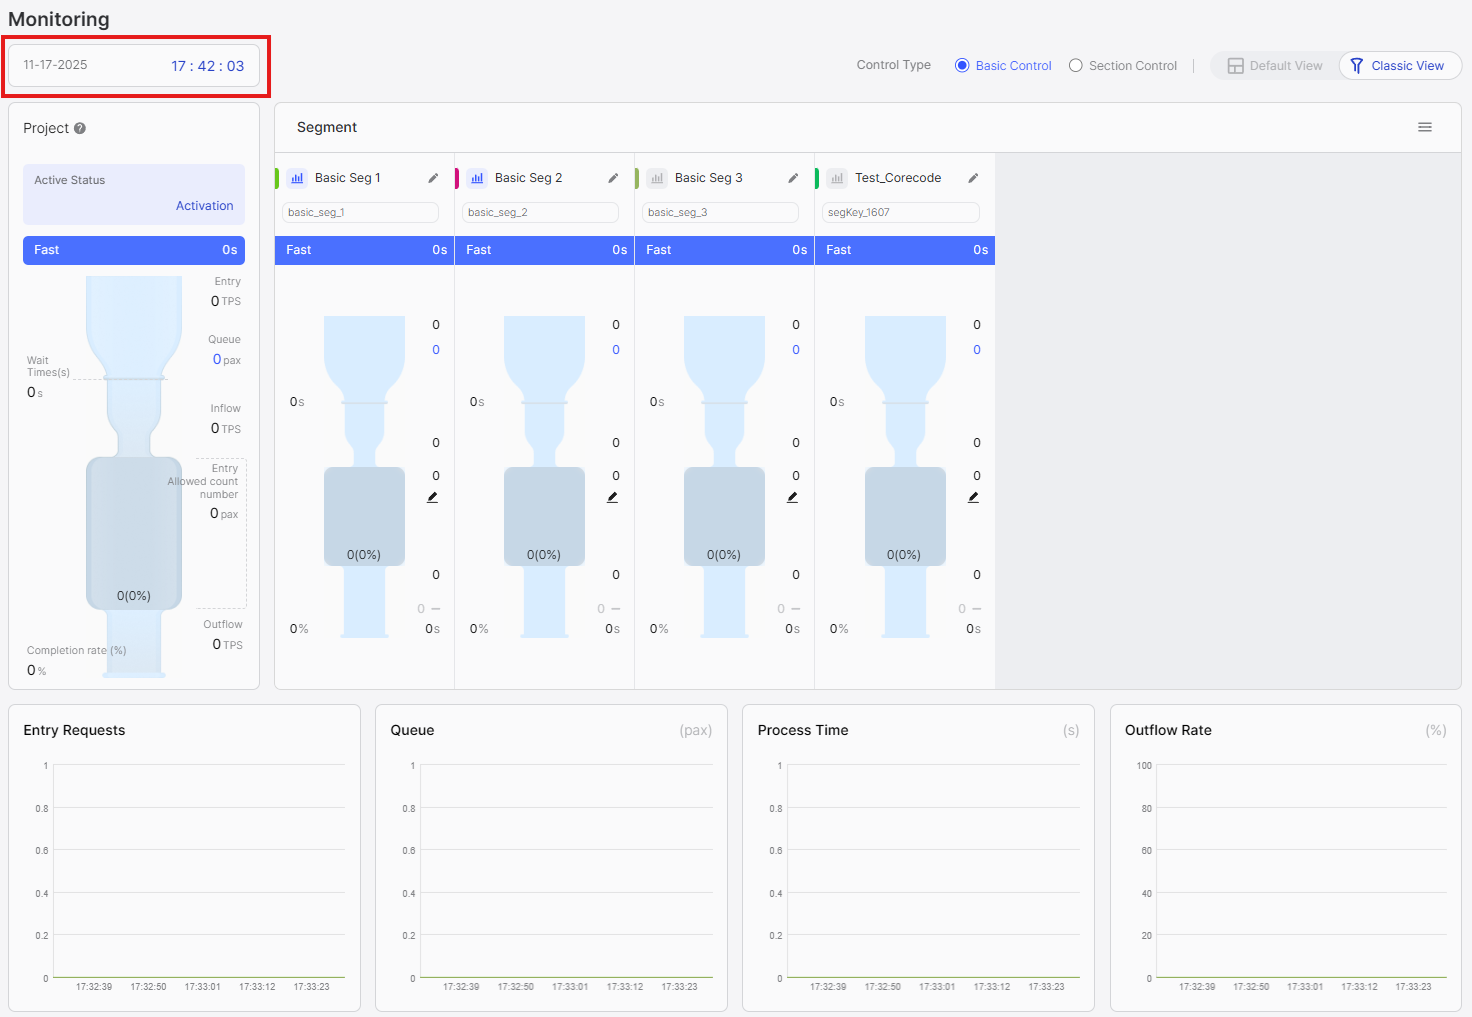
- Current Time Display: Shows the current time for reference
- Project-level Section: Aggregated metrics for the entire project
- Segment-level Section: Individual metrics for each segment
- Time Series Graph: Visual representation of metrics over time
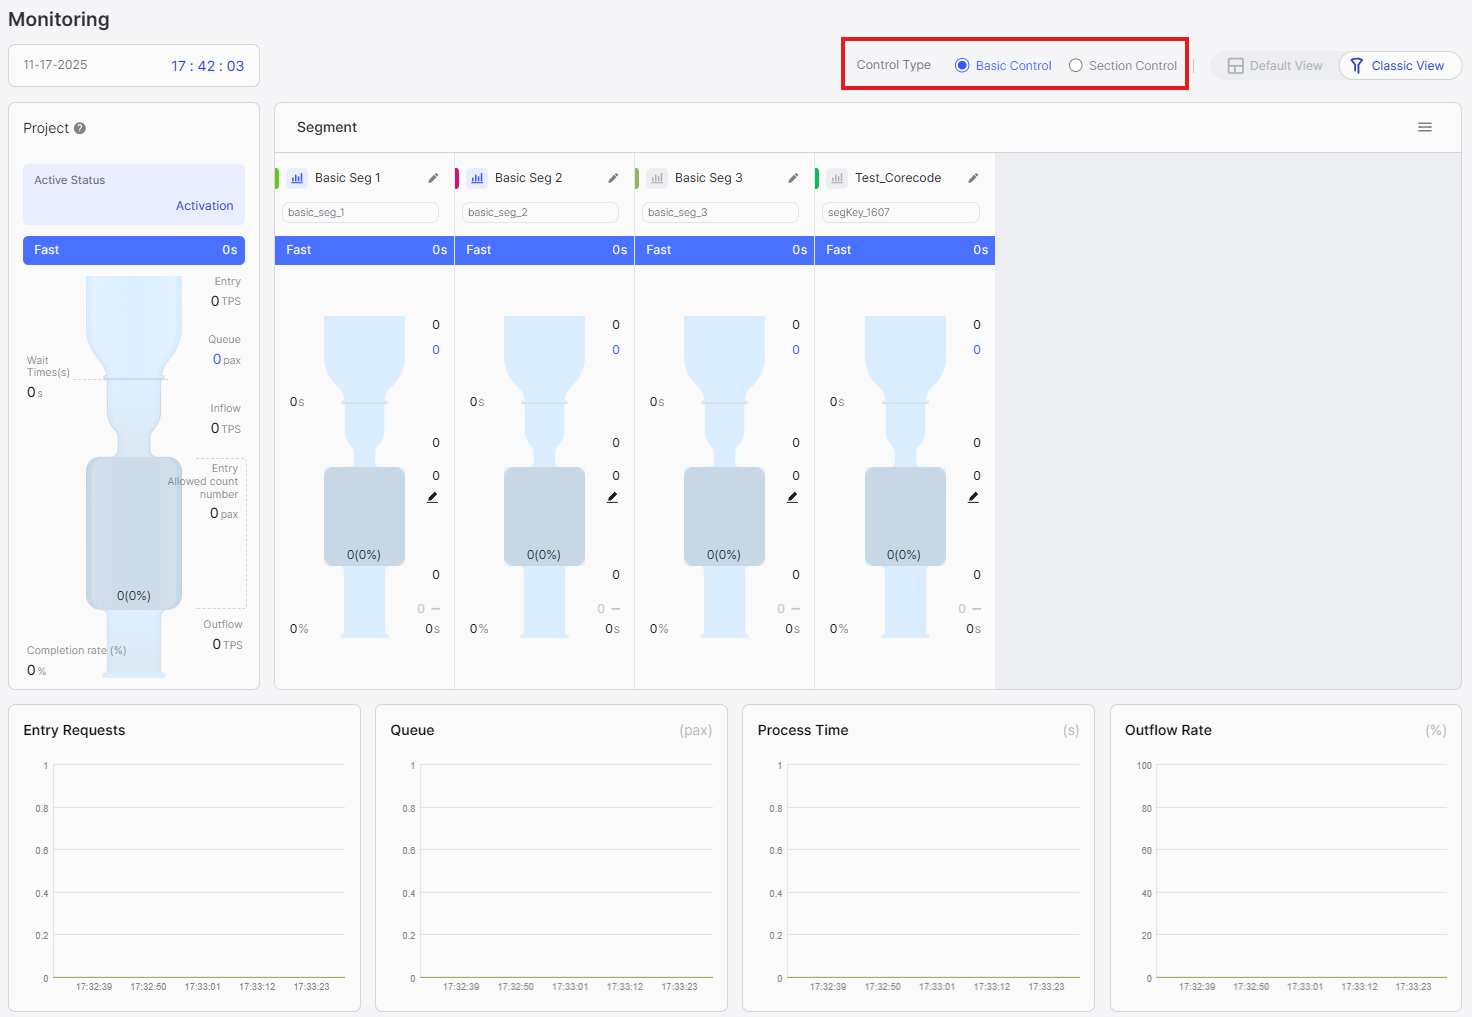
Control Type Selection
At the top of the screen, you can select which type of segments to view:
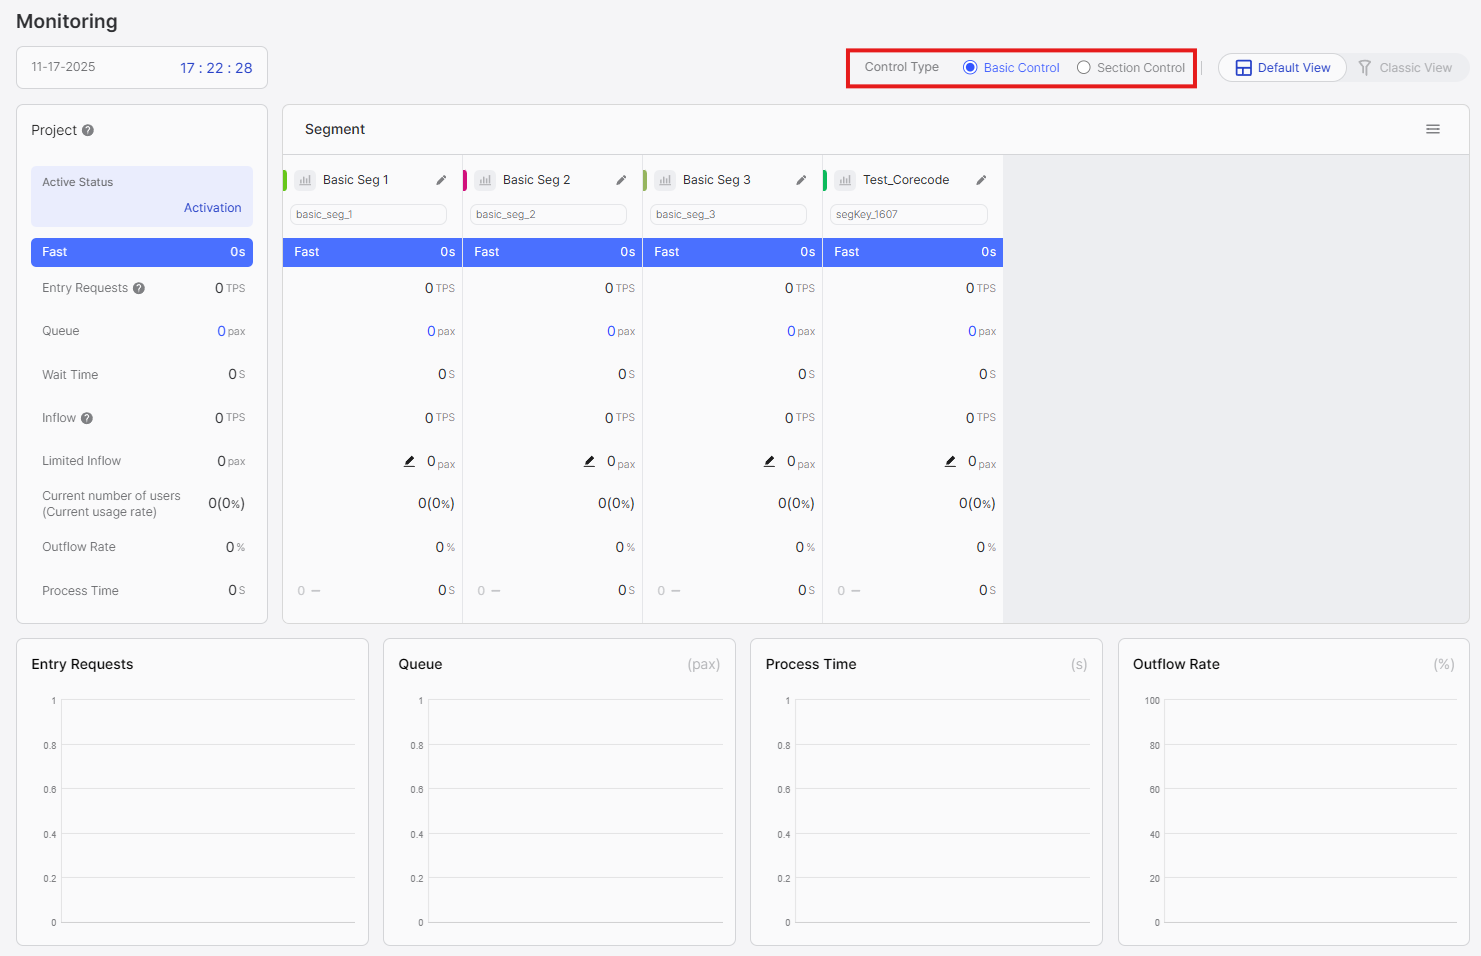
Available Options:
- Basic Control: View and monitor Basic Control segments
- Section Control: View and monitor Section Control segments
How to Use:
- Click on the desired control type tab
- The interface will filter to show only segments of the selected type
- Metrics and calculations differ between control types, so each type has its own dedicated monitoring view
Basic Control and Section Control segments have different meaningful metrics and operational characteristics. Separating them ensures you see the most relevant information for each segment type.
Current Time Display
Displays the current time in the selected timezone.
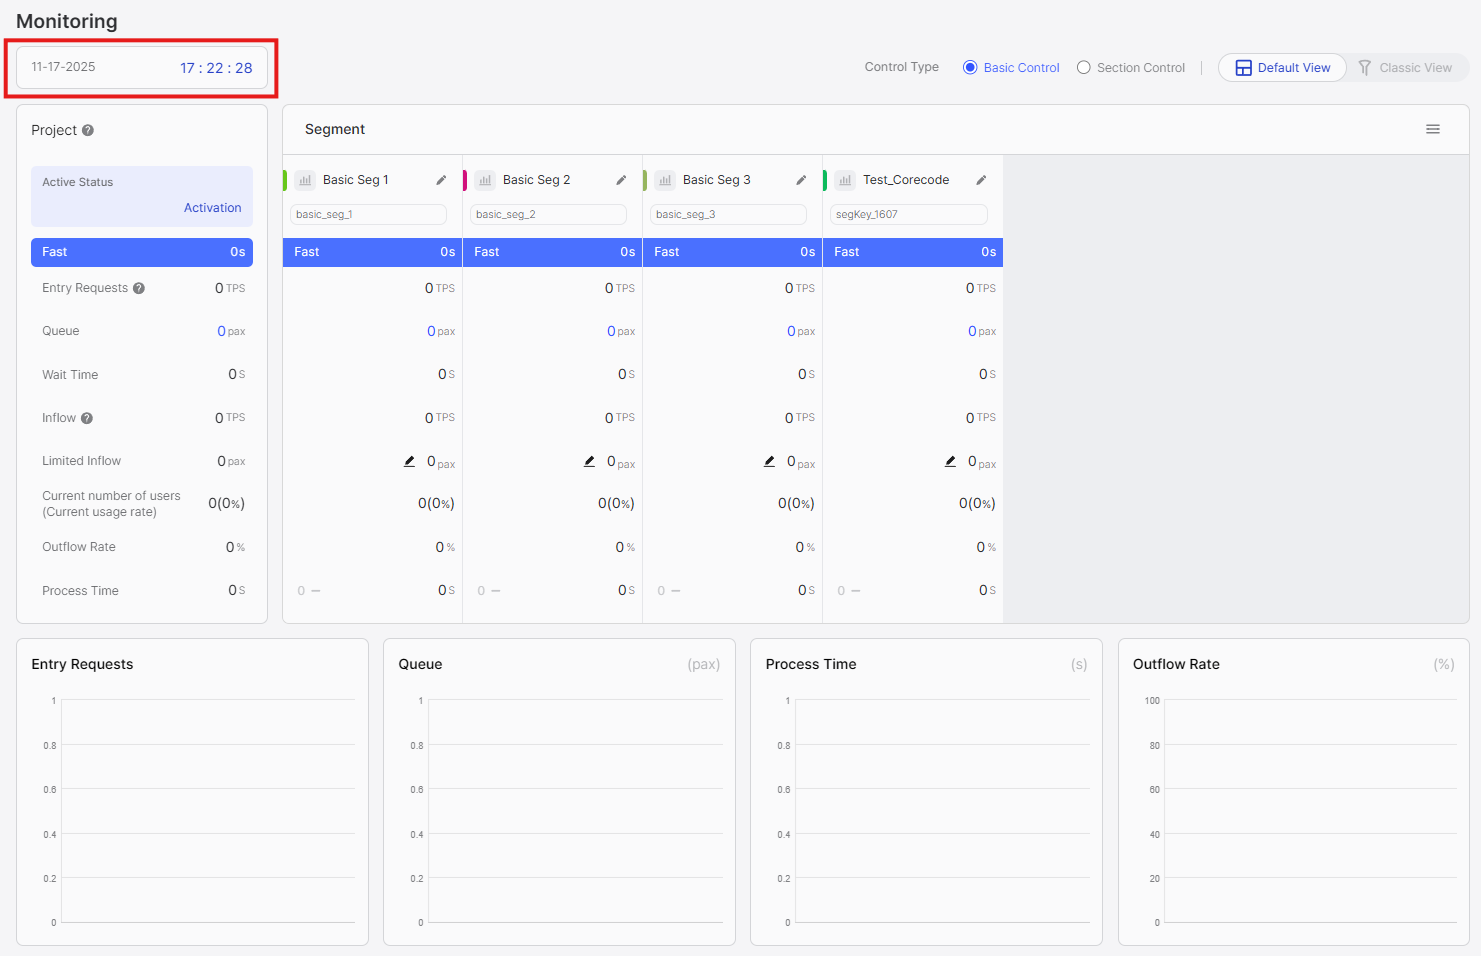
On-premise versions display time in UTC+9 (Korea Standard Time) only. This is because timezone settings cannot be changed in on-premise versions.
Project-Level Section
The project-level section displays aggregated metrics for the entire project, combining data from all segments:
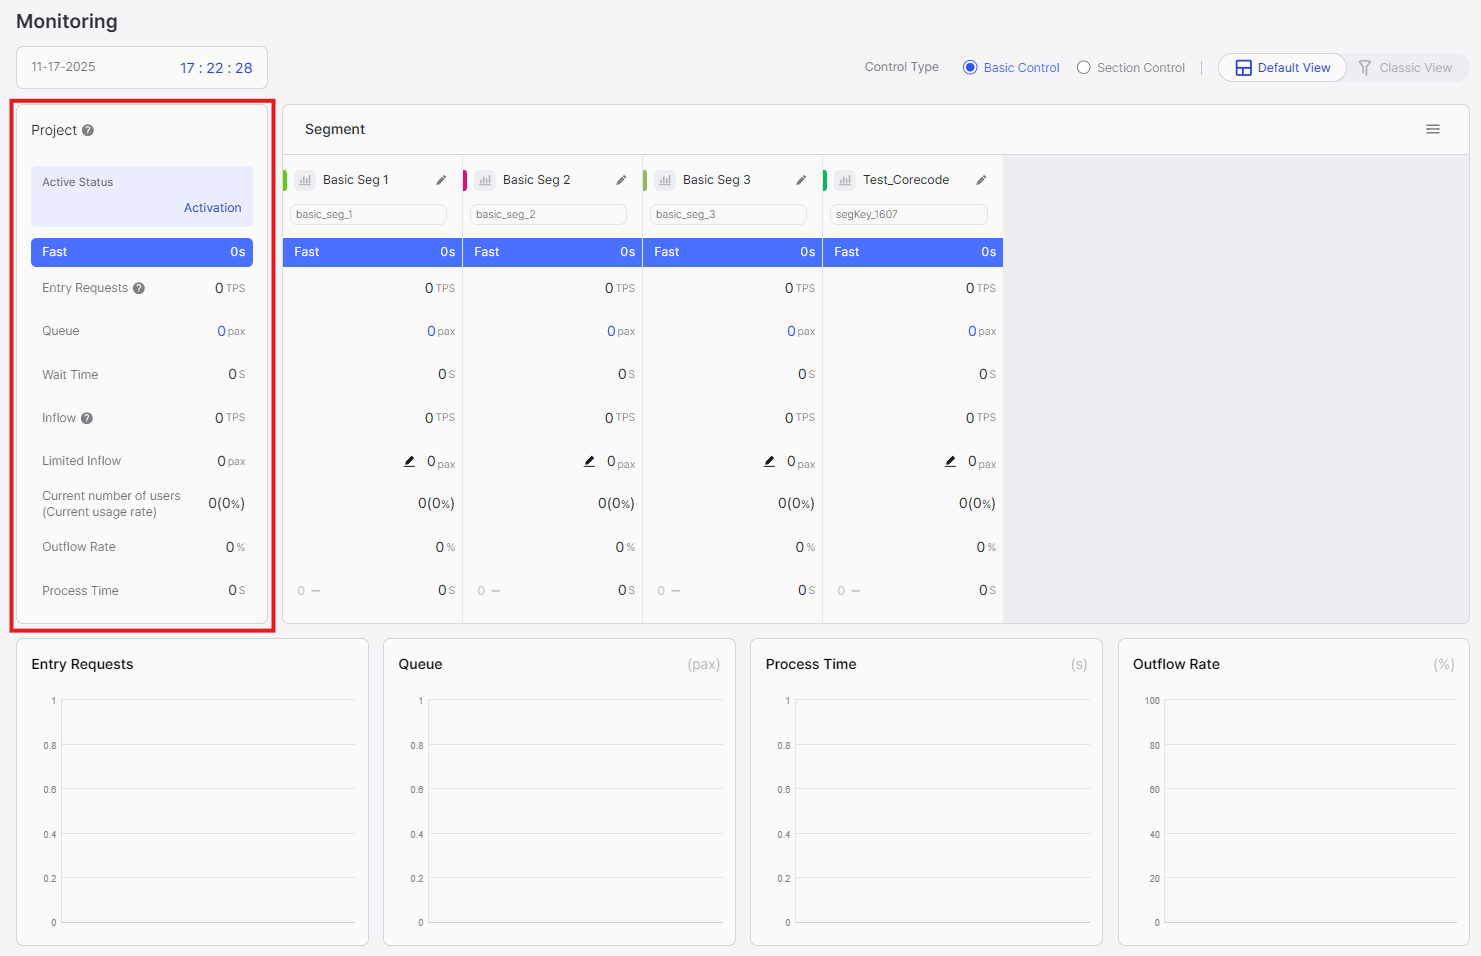
Displayed Information:
-
Active Status: Shows the project's activation state. Displays "Activation" when the project is active, "Deactivation" when inactive.
-
Waiting Status: Indicates waiting conditions with Fast/Medium/Low labels based on average waiting time. Low status indicates significant waiting in the segment. See Metrics Quick Reference for interpretation guidelines.
-
Entry Requests: Total incoming requests per second across all segments. See Metrics Quick Reference for details.
-
Queue: Total number of users waiting across all segments. See Metrics Quick Reference for details.
-
Wait Time: Average waiting time across all segments. See Metrics Quick Reference for details.
-
Expected Dropouts: Total number of users who entered the waiting room but closed their browser or lost connection across all segments. See Metrics Quick Reference for details.
-
Inflow: Total rate of requests entering the service. See Metrics Quick Reference for details.
-
Limited Inflow: Sum of Limited Inflow values from all segments. See Metrics Quick Reference for details on capacity management.
-
Current number of users (Current usage rate): Total active users across all segments and overall capacity utilization percentage. See Metrics Quick Reference and Active User Rate for details.
-
Outflow Rate: Percentage of users completing service. See Metrics Quick Reference for details.
-
Process Time: Average service processing time. See Metrics Quick Reference for details.
Use project-level metrics to understand overall system health and compare with individual segment metrics.
Segment-Level Section
The segment-level section shows individual metrics for each segment, organized into four subsections:
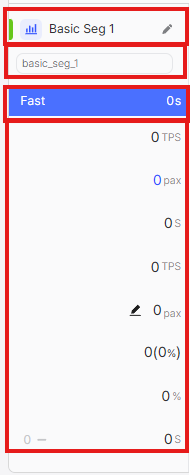
Subsection 1: Segment Header
- Graph Color: Color indicator matching the time series graph below (color cannot be changed)
- View Chart Button: Click to toggle this segment's visibility in the time series graph
- Segment Name: Name of the segment
- Segment Edit Button: Click to navigate to segment configuration page
Subsection 2: Segment Key
- Displays the unique segment key identifier
Subsection 3: Waiting Status
- Indicates waiting conditions with Fast/Medium/Low labels based on average waiting time. Low status indicates significant waiting in the segment. See Metrics Quick Reference for interpretation guidelines.
Subsection 4: Segment Run/Pause
You can control entry of waiting customers through segment run/pause functionality.
- Run: Waiting customers are entering steadily according to the configured Limited Inflow.
- Pause: Entry of waiting customers is temporarily suspended, and customers' screens display an "Entry Suspended" notice. Customers who have already entered can use the service normally, and when resuming, entry continues from the existing queue position.
Subsection 5: Metrics
- Entry Requests: Incoming requests per second for this segment. See Metrics Quick Reference for details.
- Queue: Number of users waiting for this segment. See Metrics Quick Reference for details.
- Wait Time: Average waiting time for this segment. See Metrics Quick Reference for details.
- Expected Dropouts: Number of users who entered the waiting room but closed their browser or lost connection for this segment. See Metrics Quick Reference for details.
- Inflow: Rate of requests entering the service for this segment. See Metrics Quick Reference for details.
- Limited Inflow: Configured capacity limit for this segment. See Metrics Quick Reference for details on capacity management.
- Current number of users (Current usage rate): Active users and capacity utilization percentage for this segment. See Metrics Quick Reference and Active User Rate for details.
- Outflow Rate: Percentage of users completing service for this segment. See Metrics Quick Reference for details.
- Process Time: Average service processing time for this segment. See Metrics Quick Reference for details.
Additional Features:
- Drag and Drop: Reorder segments by dragging cards to prioritize important segments
- Limited Inflow Edit: Click to adjust Limited Inflow directly from monitoring screen
Use the table format to compare metrics across segments. Drag segments to reorder them for easier monitoring.
Time Series Graph Section
The time series graph provides a visual representation of metrics over time:
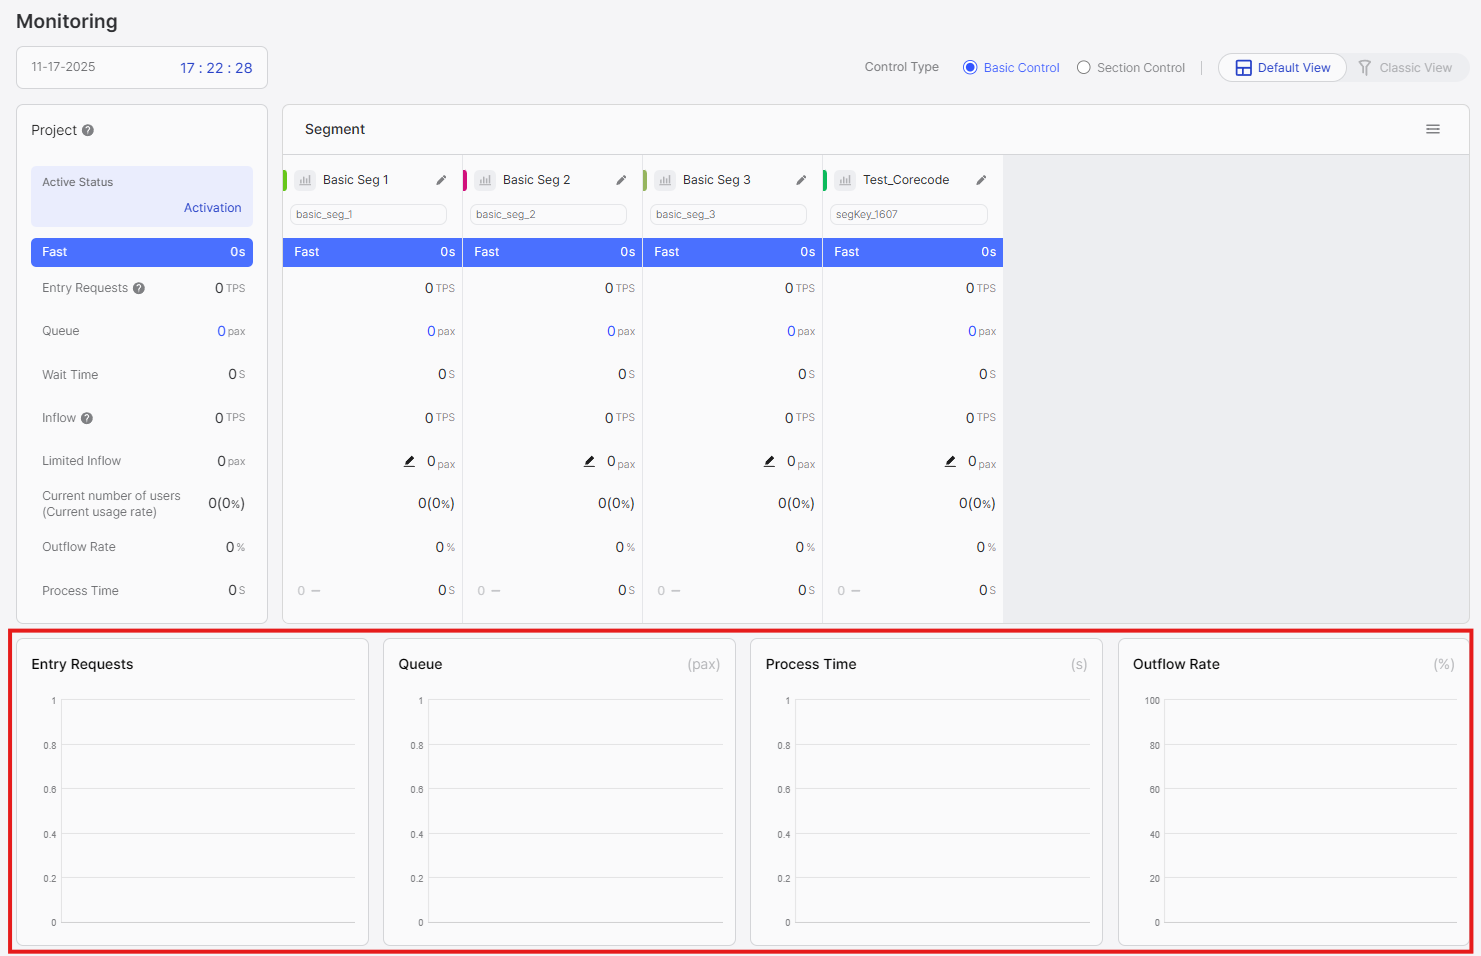
Displayed Metrics:
- Entry Requests: Incoming request rate over time (by segment)
- Queue: Number of waiting users over time (by segment)
- Process Time: Average service processing time over time (by segment)
- Outflow Rate: Percentage of users completing service over time (by segment)
Interactive Features:
- Segment Toggle: Click the graph icon next to each segment to show/hide it in the graph
- Hover Details: Hover over data points to see exact values at specific times
- Multiple Segments: Compare multiple segments simultaneously by toggling them on
Toggle segments on/off to compare patterns. Use the graph to observe trends and correlate with operational events.
Classic View
Classic View presents traffic flow using visual funnel animations, making it ideal for continuous monitoring and intuitive understanding of traffic patterns.
Screen Layout
Classic View consists of several key sections:
- Control Type Selection: Select which type of segments to view (Basic Control or Section Control)
- View Mode Selector: Switch between Default and Classic views
- Current Time Display: Shows the current time for reference
- Project-level Section: Aggregated metrics for the entire project
- Segment-level Section: Individual metrics for each segment
- Time Series Graph: Visual representation of metrics over time
Control Type Selection
At the top of the screen, you can select which type of segments to view:
Available Options:
- Basic Control: View and monitor Basic Control segments
- Section Control: View and monitor Section Control segments
How to Use:
- Click on the desired control type tab
- The interface will filter to show only segments of the selected type
- Metrics and calculations differ between control types, so each type has its own dedicated monitoring view
Current Time Display
Displays the current time in the selected timezone.
On-premise versions display time in UTC+9 (Korea Standard Time) only. This is because timezone settings cannot be changed in on-premise versions.
Project-Level Section
The project-level section displays aggregated metrics for the entire project, combining data from all segments:
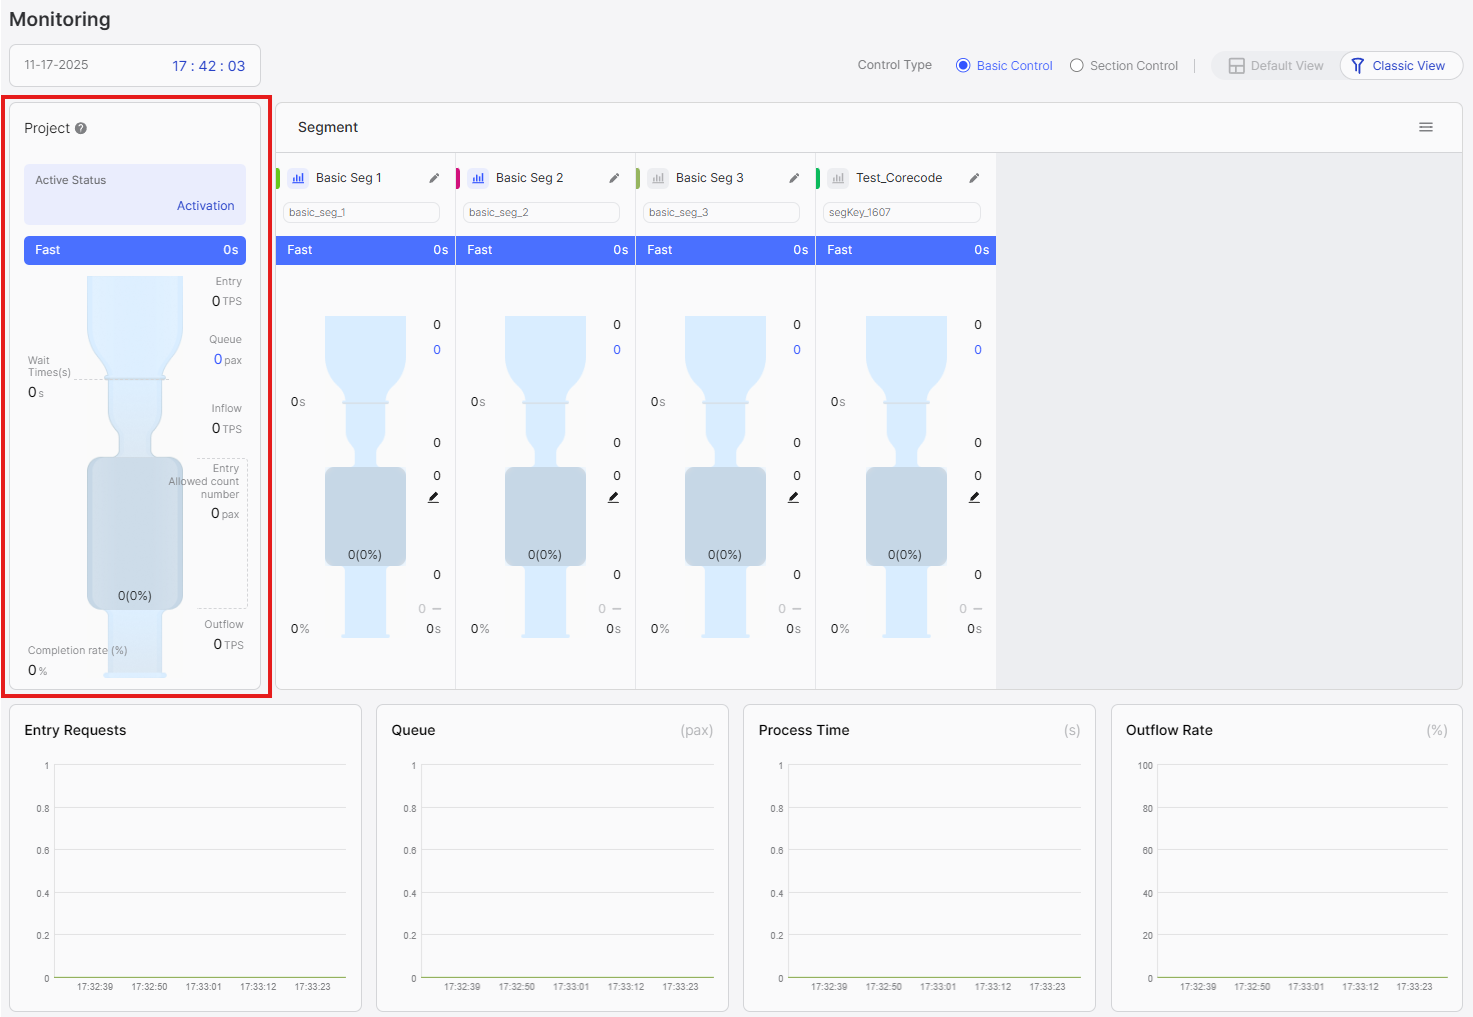
Displayed Information:
-
Active Status: Shows the project's activation state. Displays "Activation" when the project is active, "Deactivation" when inactive.
-
Waiting Status: Indicates waiting conditions with Fast/Medium/Low labels based on average waiting time. Low status indicates significant waiting in the segment. See Metrics Quick Reference for interpretation guidelines.
-
Entry: Total incoming requests per second across all segments. See Metrics Quick Reference for details.
-
Queue: Total number of users waiting across all segments. See Metrics Quick Reference for details.
-
Wait Times: Average waiting time across all segments. See Metrics Quick Reference for details.
-
Expected Dropouts: Total number of users who entered the waiting room but closed their browser or lost connection across all segments. See Metrics Quick Reference for details.
-
Inflow: Total rate of requests entering the service. See Metrics Quick Reference for details.
-
Entry Allowed count number: Sum of Limited Inflow values from all segments.
-
Current number of users (Current usage rate): Total active users across all segments and overall capacity utilization percentage. See Metrics Quick Reference and Active User Rate for details.
-
Completion rate (%): Percentage of users completing service. See Metrics Quick Reference for details.
-
Outflow: Rate at which users explicitly exit the service. See Metrics Quick Reference for details.
Use project-level metrics to understand overall system health and compare with individual segment metrics.
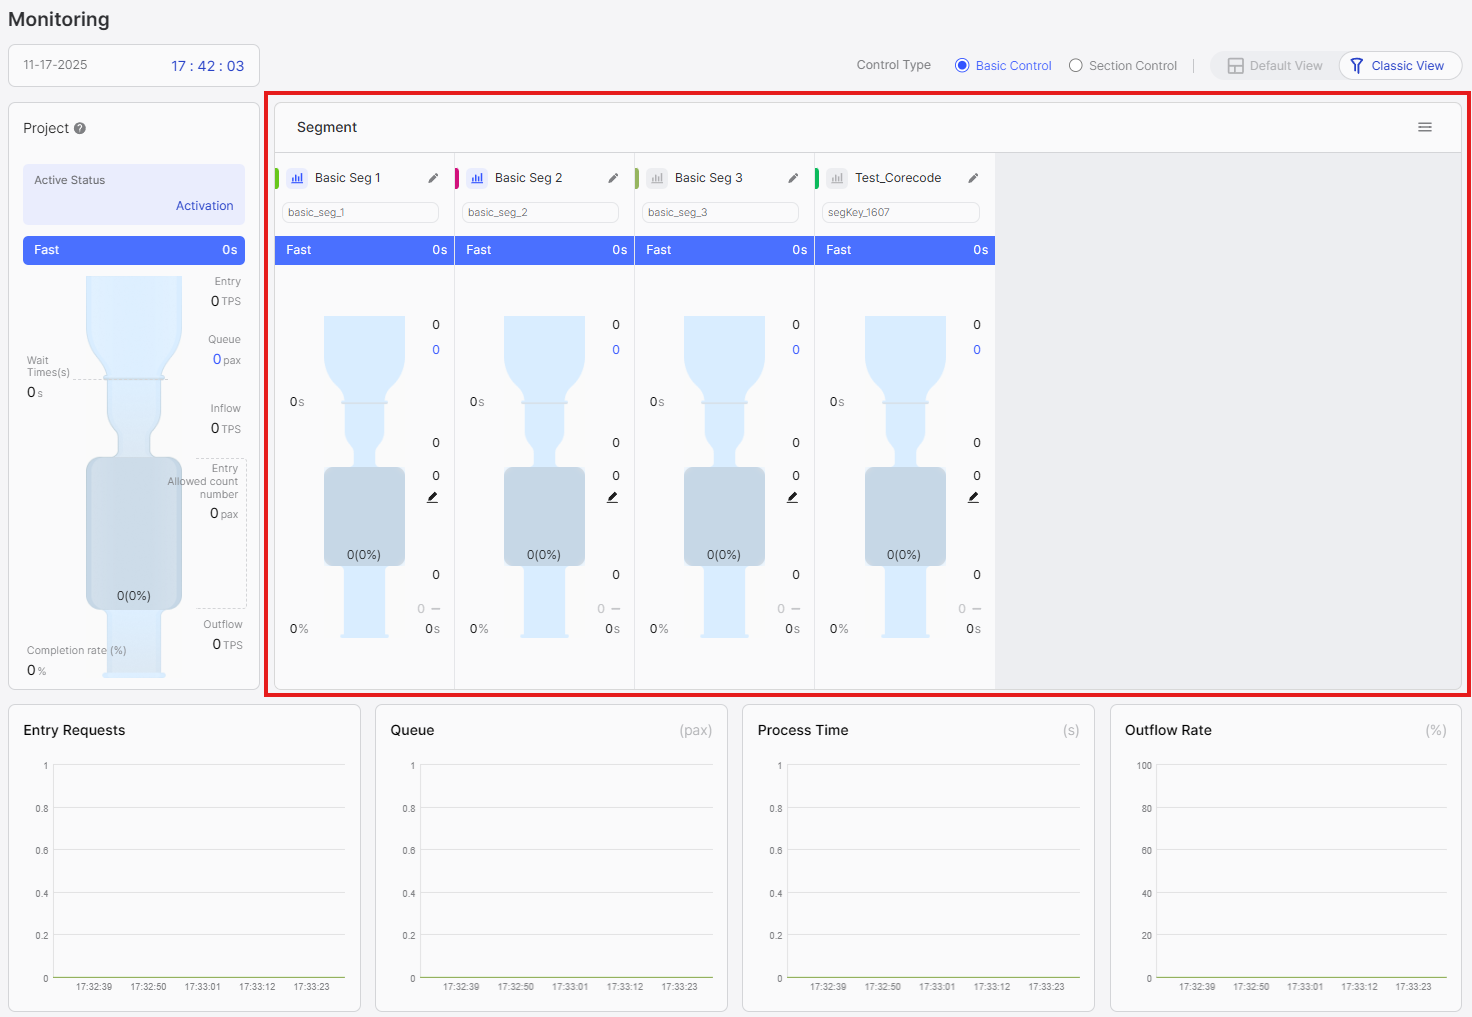
Segment-Level Section
The segment-level section shows individual metrics for each segment with visual funnel animations, organized into four subsections:
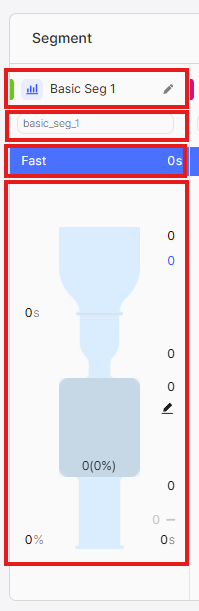
Subsection 1: Segment Header
- Graph Color: Color indicator matching the time series graph below (color cannot be changed)
- View Chart Button: Click to toggle this segment's visibility in the time series graph
- Segment Name: Name of the segment
- Segment Edit Button: Click to navigate to segment configuration page
Subsection 2: Segment Key
- Displays the unique segment key identifier
Subsection 3: Waiting Status
- Indicates waiting conditions with Fast/Medium/Low labels based on average waiting time. Low status indicates significant waiting in the segment. See Metrics Quick Reference for interpretation guidelines.
Subsection 4: Segment Run/Pause
You can control entry of waiting customers through segment run/pause functionality.
- Run: Waiting customers are entering steadily according to the configured Limited Inflow.
- Pause: Entry of waiting customers is temporarily suspended, and customers' screens display an "Entry Suspended" notice. Customers who have already entered can use the service normally, and when resuming, entry continues from the existing queue position.
Subsection 5: Metrics
- Entry Requests: Incoming requests per second for this segment. See Metrics Quick Reference for details.
- Queue: Number of users waiting for this segment. See Metrics Quick Reference for details.
- Wait Time: Average waiting time for this segment. See Metrics Quick Reference for details.
- Expected Dropouts: Number of users who entered the waiting room but closed their browser or lost connection for this segment. See Metrics Quick Reference for details.
- Inflow: Rate of requests entering the service for this segment. See Metrics Quick Reference for details.
- Limited Inflow: Configured capacity limit for this segment. See Metrics Quick Reference for details on capacity management.
- Current number of users (Current usage rate): Active users and capacity utilization percentage for this segment. See Metrics Quick Reference and Active User Rate for details.
- Outflow Rate: Percentage of users completing service for this segment. See Metrics Quick Reference for details.
- Process Time: Average service processing time for this segment. See Metrics Quick Reference for details.
- Outflow: Rate at which users explicitly exit the service for this segment. See Metrics Quick Reference for details.
Visual Features:
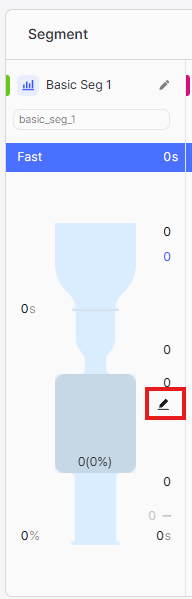
- Visual Funnel: Animated funnel showing traffic flow with water drop effects
Understanding the Funnel Visualization:
The funnel is divided into three main sections:
Section 1: Entry Requests (Falling Drops)
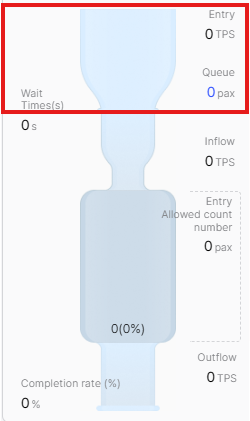
The water drops falling into the funnel represent Initial Entry Requests - all users attempting to access your service. Each drop represents a request entering the system. This is the demand side of your traffic.
Section 2: Service Entry (Funnel Container)
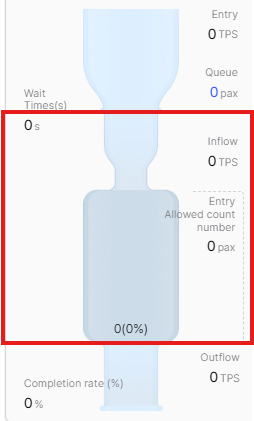
The funnel container represents requests that have received a PASS response and entered your service (Inflow). The funnel's characteristics show:
- Funnel depth: Represents Limited Inflow - your configured capacity limit
- Water level: Represents Active Users - current number of users actively using your service
- Water level percentage: Represents Active User Rate - how much of your capacity is currently being used
When the water level approaches the funnel's depth (Limited Inflow), new requests will be queued instead of entering immediately.
Section 3: Service Exit (Exiting Drops)
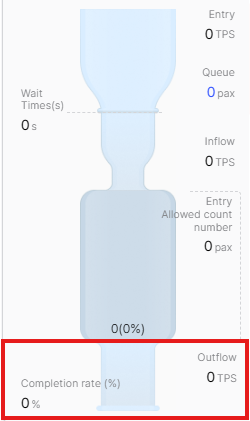
The water drops exiting the funnel represent Explicit Exits (Outflow) - users who have explicitly completed their service and returned their keys via nfStop(). These drops show the rate at which capacity is being freed up for new users.
- Many drops falling in, few entering: High demand, capacity may be limited
- Water level near funnel depth: Active Users approaching Limited Inflow - capacity nearly full
- Few drops exiting: Low Outflow - may indicate missing
nfStop()calls or long timeouts - Steady flow: Healthy traffic pattern with balanced entry and exit
Additional Features:
- Limited Inflow Edit: Click to adjust Limited Inflow directly from monitoring screen
Time Series Graph Section
The time series graph provides a visual representation of metrics over time:
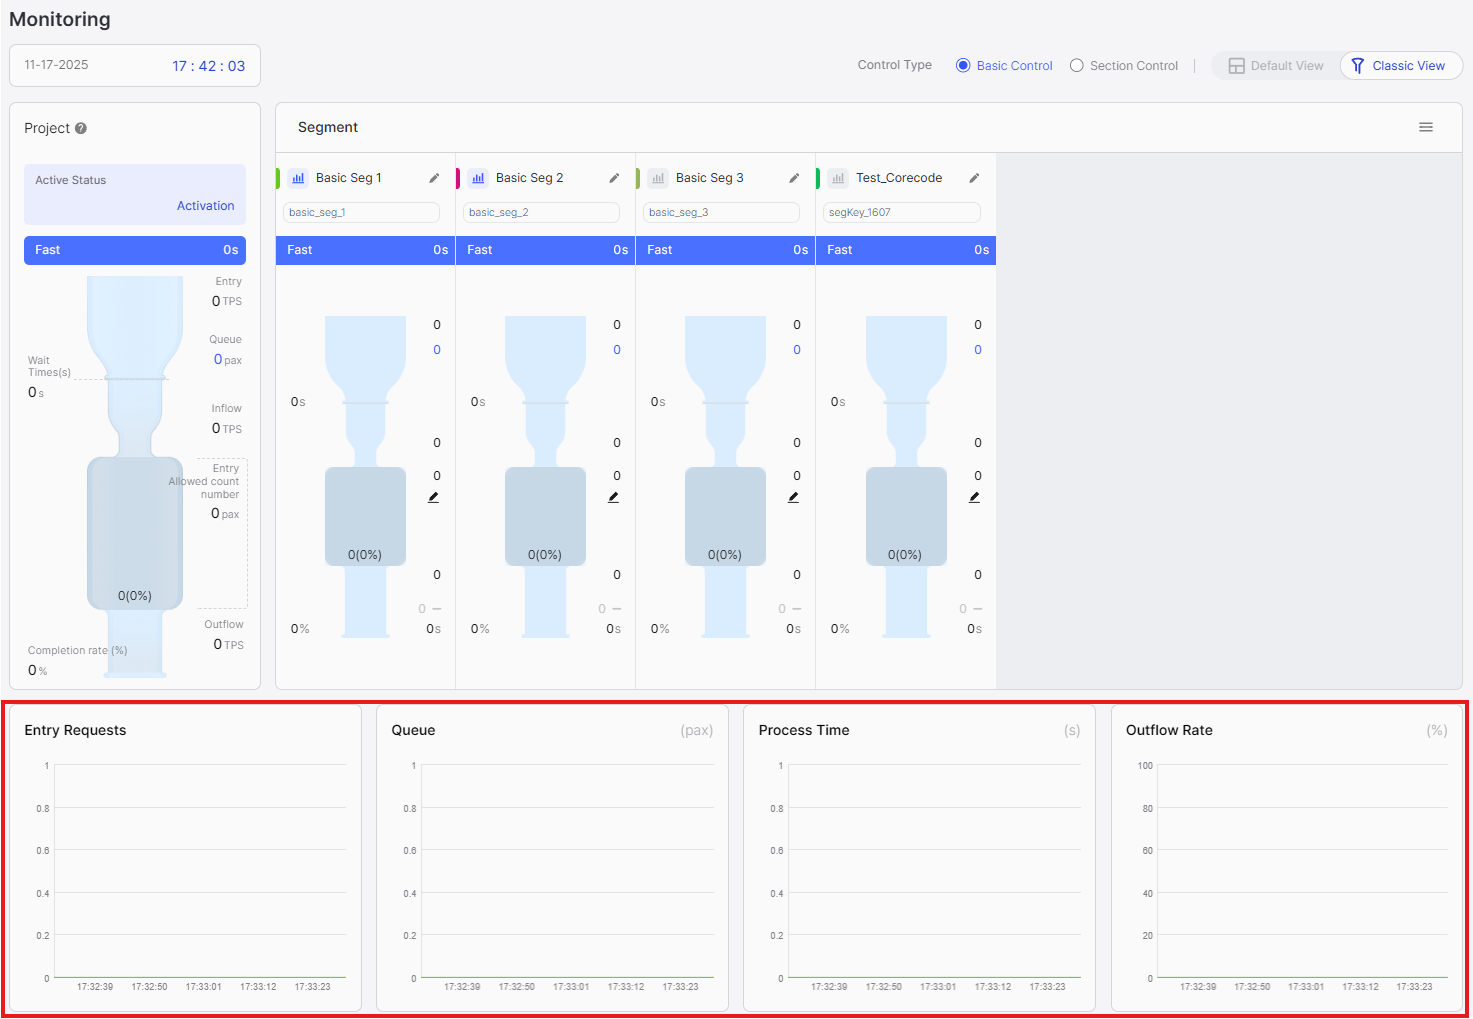
Displayed Metrics:
- Entry Requests: Incoming request rate over time (by segment)
- Queue: Number of waiting users over time (by segment)
- Process Time: Average service processing time over time (by segment)
- Outflow Rate: Percentage of users completing service over time (by segment)
Interactive Features:
- Segment Toggle: Click the graph icon next to each segment to show/hide it in the graph
- Hover Details: Hover over data points to see exact values at specific times
- Multiple Segments: Compare multiple segments simultaneously by toggling them on
Toggle segments on/off to compare patterns. Use the graph to observe trends and correlate with operational events.
Classic View excels at showing "what's happening" visually through funnel animations, while Default View excels at showing "exactly how much" numerically. Use both views complementarily.
Common Operations
Adjusting Limited Inflow
You can quickly adjust Limited Inflow directly from the monitoring screen without navigating to the segment configuration page. This feature is available in both Default View and Classic View.
Default View:
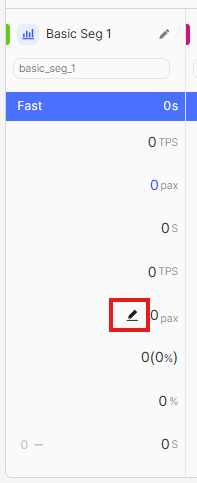
Click the edit icon next to Limited Inflow in the segment-level section.
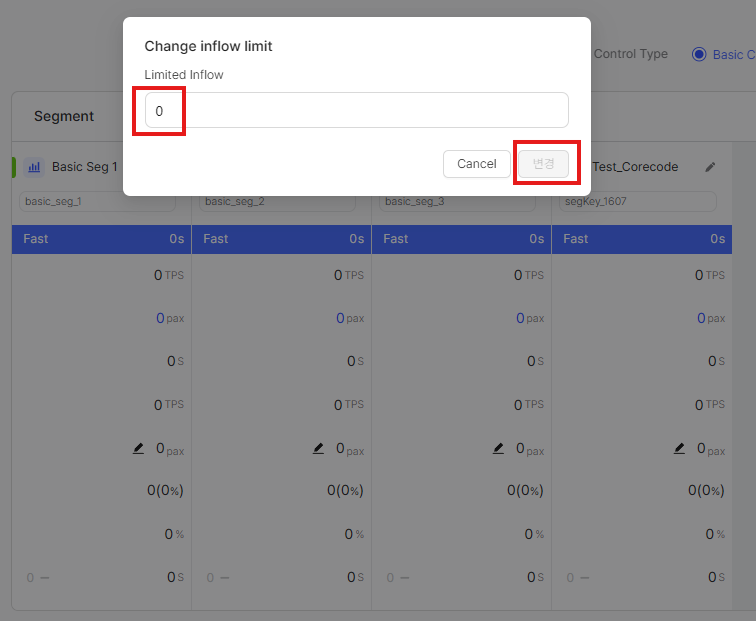
Classic View:
Click the edit icon next to Limited Inflow in the segment-level section. Enter the new value in the popup dialog and confirm. Monitor metrics in real-time after the change.
- Increasing: Incrementally (10-20% at a time) and monitor server resources
- Decreasing: More aggressively (40-50%) to quickly protect server capacity
- Always monitor Process Time and server metrics when making adjustments
Reordering Segments
Drag segment cards to reorder them. The new order persists for your session.
Filtering Graph Display
Click the graph icon next to each segment name to toggle its visibility in the time series graph.
Switching Between Control Types
Click the control type tab (Basic Control or Section Control) at the top. The interface will load the selected type's view with appropriate metrics and calculations.